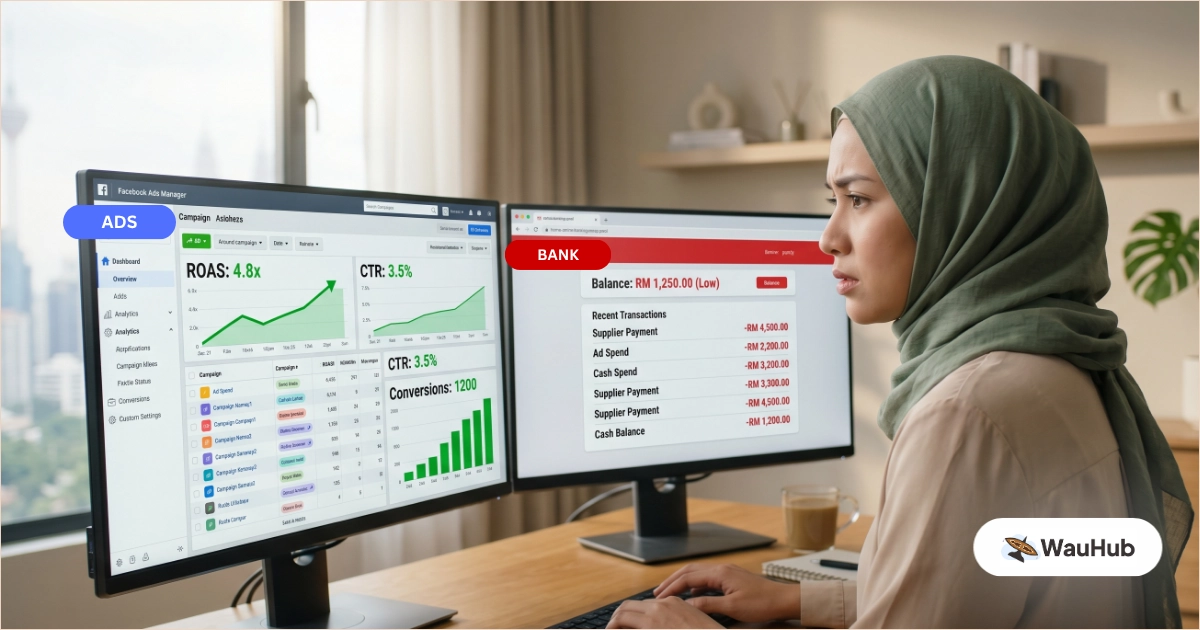
Your Facebook Ads dashboard says you spent RM4,000 last month and generated 120 leads. Cost per lead: RM33. Your ad manager tells you the campaign is “performing well.”
Your Instagram influencer posted a Reel about your Turkey tour. 45,000 views. 200 DMs. She tells you it was a “huge success.”
You feel good. Marketing is working. Leads are coming in.
Then you check your bank balance at month end. It has not moved.
The Disconnect Nobody Measures
Here is the gap most Malaysian travel agencies never close: marketing metrics and tour profitability live in completely different worlds.
Your ads report tells you cost per lead, click-through rate, impressions. Your influencer gives you views, comments, DMs received.
None of these numbers tell you whether the tours those leads booked actually made money.
A lead is not profit. A booking is not profit. Even revenue is not profit. Profit only exists after you subtract every cost tied to that tour, including the marketing spend that brought the customer in.
Most agencies never connect the two. The marketing budget sits in one mental bucket. Tour costs sit in another. They never meet. And that is where money disappears.
The RM33 Lead That Cost You Money
You run Facebook ads for your Budget Bandung 4D3N package. The numbers look healthy:
- Monthly ad spend: RM1,500
- Leads generated: 45
- Cost per lead: RM33
- Bookings confirmed: 6
- Cost per booking (ad spend only): RM250
RM250 per booking sounds excellent for travel. But now look at the tour economics:
| Tour Cost (20 pax group) | Per Pax | |
|---|---|---|
| Selling price | RM1,800 | |
| Flight | RM13,600 | RM680 |
| Hotel (2 nights) | RM7,200 | RM360 |
| Transport (coach, 4 days) | RM3,600 | RM180 |
| Tour guide (4 days × RM280/day) | RM1,120 | RM56 |
| Meals & entrance | RM4,080 | RM204 |
| Total supplier cost | RM29,600 | RM1,480 |
| Gross margin | RM320 (17.8%) | |
| Ad cost allocated per booking | RM250 | |
| Payment gateway fee (1.5%) | RM27 | |
| Net margin | RM43 (2.4%) |
2.4% net margin. On a tour that took your consultant 3 hours to close and 8 WhatsApp conversations to confirm.
Your “profitable” ad campaign fed an unprofitable tour. But your ads dashboard still shows green.
Now Add the Middle East Crisis to the Equation
Since the Middle East conflict escalated, oil prices have surged. Airlines reduced frequencies on key routes. Ticket prices jumped 15% to 30% on Europe and Middle East sectors. Some agencies saw their Turkey tour flight cost increase by RM800 per pax overnight.
This creates a brutal choice for every agency:
Absorb the cost increase. Your margin shrinks from RM1,700 to RM900 per pax. If you are still spending RM250 per booking on ads, your net profit drops to almost nothing.
Pass it to the customer. You raise the selling price by RM800. Some customers accept it. Others walk away to the agency that absorbed the cost. Your conversion rate drops, which means your cost per lead effectively increases because fewer leads convert.
Either way, your per-tour P&L changes dramatically. And if you are not tracking it, you will not know which tours are still viable and which ones are now bleeding money at the new cost structure.
Agencies that track per-tour P&L saw the problem immediately. They paused ads on affected routes within days. They shifted budget to domestic and ASEAN tours where flight costs stayed stable. Agencies that do not track? They kept running the same campaigns for weeks, burning money on tours that no longer had margin to support paid acquisition.
Why Influencer “Success” Is Often a Mirage
The typical influencer engagement:
- Fee: RM5,000 for 1 Reel + 3 Stories
- Views: 45,000
- DMs/enquiries: 200
- Bookings from those enquiries: 8
Sounds great. But which tour did they book?
If those 8 customers booked your Japan 7D6N at RM6,800 per pax (gross margin RM1,600), the influencer generated RM12,800 in gross profit. Minus the RM5,000 fee, you netted RM7,800. Solid return.
But if those 8 customers booked your budget Vietnam 5D4N at RM2,400 per pax (gross margin RM380), the influencer generated RM3,040 in gross profit. Minus the RM5,000 fee, you lost RM1,960.
Same influencer. Same fee. Same “success metrics.” Completely different financial outcome.
Budget-focused influencers attract budget-focused travellers. They book your lowest-margin packages. You pay premium fees to acquire customers who generate the least profit. Without connecting influencer spend to per-tour P&L, you will never see this pattern.
The Scaling Trap
When agencies see “good” marketing metrics, they do the logical thing: spend more.
- Ads generate leads at RM33 each. “Let us double the budget.”
- Budget goes from RM3,000 to RM6,000.
- Bookings increase by 30%. Revenue goes up.
- But the additional bookings skew toward lower-margin tours.
- Net profit stays flat. Or drops.
You scaled your marketing. You did not scale your profit. Because you never asked: “Which tours should I be spending money to promote?”
Where the Budget Should Actually Go
An agency running 4 tour types with RM6,000 monthly ad budget, split equally:
| Tour | Ad Spend | Bookings | Margin Per Booking | Net Return | ROI % |
|---|---|---|---|---|---|
| Bandung 4D3N | RM1,500 | 12 | RM320 | RM2,340 | 156% |
| Bali 5D4N | RM1,500 | 8 | RM1,100 | RM7,300 | 487% |
| Japan 7D6N | RM1,500 | 5 | RM1,600 | RM6,500 | 433% |
| Turkey 10D9N | RM1,500 | 4 | RM1,700 | RM5,300 | 353% |
The smart move: shift budget from Bandung to Bali and Japan. Bali returns 487% on ad spend. Bandung returns 156%. The difference is obvious when you see the percentages.
Same RM6,000 budget, reallocated by return:
- Total net return with equal split: RM21,440
- Total net return with optimised split: RM25,880
RM4,440 more profit per month. RM53,280 per year. Same ad budget. Zero extra work. Just better allocation based on per-tour P&L data.
The Cuti Sekolah Promotion Test
Cuti sekolah promotion just ended. You ran ads, maybe paid an influencer, offered early bird discounts. 40 bookings came in. Staff worked overtime. Everyone felt like it was a great month.
But can you answer these questions?
- Which tour generated the most profit (not revenue, profit)?
- Did the early bird discount eat your entire margin on certain packages?
- Was the influencer fee justified by the bookings it generated?
- Did the Yunnan tour (viral among Malaysians right now) actually make money, or did the hype just create volume with thin margins?
- With flight costs up on certain routes, which cuti sekolah tours are no longer viable at current pricing?
If you cannot answer these, you are making next quarter’s decisions based on feelings. You will repeat the same promotions, pay the same influencers, run the same ads, and wonder again why the bank balance does not reflect the “busy” month.
The Influencer Decision Framework
Before paying any influencer, answer these:
| Question | Why It Matters |
|---|---|
| Which specific tour will this promote? | You need to calculate if the margin can absorb the fee |
| What is the gross margin on that tour? | At RM300 margin, you need 17 bookings from a RM5,000 influencer just to break even |
| What is the influencer’s audience profile? | Budget travel influencer + premium tour = mismatch |
| How will you track conversions? | Unique promo code, dedicated WhatsApp number, or specific landing page |
| What is your minimum acceptable return? | Set a rule: “We only pay if we expect at least 2x return” |
At RM300 margin per pax, you need 34 confirmed bookings from a RM10,000 influencer to hit 2x return. That is almost impossible from a single post. The math kills the deal before you sign the contract.
Start Here: One Tour, One Month
Pick your most-promoted tour. The one you spend the most ad money on.
Track this month:
- Total ad spend allocated to that tour
- Number of confirmed bookings from those ads
- All supplier costs (including any flight cost increases)
- Influencer fees tied to that tour
- Payment processing fees
Then calculate:
- True margin per booking (revenue - supplier cost - marketing cost - fees)
- Return on ad spend (gross profit ÷ ad spend)
If the return is below 2x, you have a problem. Either the tour margin is too thin for paid acquisition, your targeting is wrong, or the cost structure changed (hello, fuel surcharges) and your pricing has not caught up.
Do this for one tour. Then next month, do it for two. Within a quarter, you will have visibility across your top tours. And you will make very different decisions about where your marketing ringgit goes.
The Question That Changes Everything
Next time your ad manager shows you a report with green metrics and upward arrows, ask one question:
“Which tours did these leads book, and what was the net profit after we include the ad spend?”
If they cannot answer, you are flying blind. The ads might be “working” by marketing standards while actively losing you money by business standards.
With oil prices volatile, flight costs unpredictable, and margins thinner than ever, you cannot afford to guess which tours deserve your marketing budget. The agencies that grow profitably are not the ones spending the most. They are the ones who know exactly what each ringgit returns, per tour, per channel, per month.
Related reading: